
CanESS Model Information -
Table of Contents
1.1 Overview
1.2 Applications
1.3 Case Studies
1.4 Model Access, Maintenance & Platform
1.5 Modelling Approach & Philosophy
2 CanESS Technical Description
2.2.1 Demographics
2.2.2 Macro Economy
2.3.1 Residential End-use
2.3.2 Commercial End-use
2.3.3 Transportation
2.3.4 Industrial
2.4.1 Electricity Generation
2.4.2 Refined Petroleum Products
2.4.3 Biofuels
2.4.4 Other Transportation Fuels
2.4.5 Hydrogen
2.4.5 Liquid Natural Gas
2.4.6 Steam
2.4.7 Decentralized Energy
2.5.1 Crude Oil
2.5.2 Natural Gas
2.5.3 Natural Gas Liquids
2.5.4 Coal
2.5.5 Uranium
2.5.6 Biomass
1 CanESS Introduction
1.1 Overview
The Canadian Energy Systems Simulator (CanESS), developed by whatIf? Technologies Inc., is an integrated, multi-fuel, multi-sector, provincially-disaggregated energy systems model for Canada. CanESS enables bottom-up accounting for energy supply and demand, including energy feedstocks (e.g. coal, oil, gas), energy consuming stocks (e.g. vehicles, appliances, dwellings) and all intermediate energy flows. It is calibrated with observed historical data from 1978 to the present, and it enables projection of scenarios forward to 2050 and beyond. The conceptual view of the energy system which underlies the development of CanESS is shown Figure 1.1.1.
Figure 1.1.1 - Conceptual view of an energy system underlying the design of CanESS

CanESS focuses on coherency – on creating scenarios assuring consistency among the population, level of economic activity, the services required by the population, the energy system, and the emissions of greenhouse gases and criteria air contaminants. It assures coherency both over time and within time periods through the use of stock-flow accounting rules, vintaged stocks and life tables, supply/disposition balances for fuels and feedstocks, and the explicit representation of energy transformations. The major sub-models and high level computational structure of CanESS are shown in Figure 1.1.2. A detailed description of the sub-models is presented in the Technical Description section.
Figure 1.1.2 - High level computational structure of CanESS

CanESS is calibrated over historical time from 1978 to the present in one year steps. The result of the calibration is a complete historical database of all of the variables in CanESS adjusted to be coherent with the stock-flow and supply/disposition balance accounting identities of CanESS. This database is a synthesis of data from a wide variety of data sources including: Statistics Canada; the Office of Energy Efficiency, Natural Resources Canada; Transport Canada; Environment Canada; the National Energy Board; and technical data from various scientific and engineering studies.
CanESS is developed and maintained by whatIf? Technologies Inc., an Ottawa-based firm founded in 1989 specializing in modelling, simulation and quantitative scenario analysis. The firm develops the whatIf? Modelling Platform, upon which CanESS operates, and provides custom modelling services across various subject domains. CanESS is the company’s flagship application product and is accessible on both a project and subscription basis.
1.2 Applications
CanESS is able to explore a wide variety of energy systems analysis topics. Here is a selection of issues and themes CanESS can address:
-
fuel switching
-
national and provincial carbon budgets
-
energy efficiency potential
-
building envelope retrofit impacts
-
technology assessment
-
integration of intermittent renewable energy sources
-
international and interprovincial energy trade
-
electricity generation capacity planning and “greening” the grid
-
energy system costs
-
carbon intensity of oil sands production
-
travel behaviour change impacts
-
vehicle fuel standards impacts
-
electric, hydrogen & renewable-fuel vehicle energy analysis
-
freight transportation fuel options
-
electricity demand response
-
combined heat and power (CHP)
-
multi-generational energy infrastructure planning
-
sensitivity of energy demand to variation of population and economic projections
-
shifting lifestyles and energy use linkage
1.3 Case Studies
Behind the Switch: Pricing Ontario Electricity Options - Pembina Institute
whatIf? Technologies, in collaboration with Navigant Consulting, supported the Pembina Institute in using CanESS to examine power prices in Ontario to 2030. Specifically, this project explored the impact of deploying wind generation capacity as foreseen in Ontario’s Green Energy Act relative to a greater reliance on natural gas generation. The scenarios examined power prices and quantified their sensitivity to future demand for electricity, natural gas prices, and costs of building new nuclear generating capacity. CanESS was enhanced for this analysis to include an hourly system load shape composed of electricity use profiles from multiple demand sectors and an hourly dispatch of generating capacity to meet this demand.
See: Report
Alberta Energy Efficiency Scenarios - Alberta Department of Energy
In this study for the Alberta Department of Energy, CanESS was used to assess the potential for energy efficiency improvements to modify overall energy demand and reduce emissions in Alberta. Simulated energy efficiency improvements targeted over 30 measures across the residential, commercial, transportation and some specific industrial sectors.
Trottier Energy Futures Project - David Suzuki Foundation, The Canadian Academy of Engineering, Trottier Family Foundation
The Trottier Energy Futures Project (TEFP) is a research and modelling effort to determine how Canada can dramatically reduce its emissions of the greenhouse gas emissions.
Scenario Analysis of a Utility-Scale Deployment of Marine Energy Technology in Canada - CanmetENERGY, Natural Resources Canada
whatIf? Technologies, in collaboration with Navigant Consulting, used CanESS to quantify the impact of utility scale deployment of marine energy technologies (tidal, wave, in-river current) in 5 jurisdictions across Canada. This analysis utilized CanESS’ hourly electricity dispatch algorithm taking into account the unique intermittency profiles of marine resources.
Your Energy Story website - Senator Elaine McCoy
Your Energy Story is a collaborative energy literacy project spearheaded by Senator Elaine McCoy, designed to make linkages between energy end uses and energy sources. The site is driven by CanESS-produced data.
See: yourenergystory.ca
1.4 Model Access, Maintenance & Platform
CanESS may be accessed by users on either a project or ongoing subscription basis. The model is continually updated with respect to: data from various sources (see Data Sources and Calibration); and model design and structure - that is, the range and depth of analytical issues it can address.
The model is developed on and accessed with the whatIf? Modelling Platform which provides transparency, flexibility, data visualization and scenario management.
1.5 Modelling Approach & Philosophy
At its core, CanESS is a stocks-and-flows accounting-framework class of model which represents the physical state of Canada’s energy system over time - for the observed past and for alternative future scenarios. Alternative models of actor-based behaviour may be incorporated in scenarios, operating “above” and constrained by the underlying physical accounting framework. The model platform incorporates and adapts concepts from the system dynamics approach to complex systems analysis.
For any given year within its time horizon, CanESS traces the flows and transformations of energy from sources (e.g. crude oil, uranium, wind), through energy currencies (e.g. gasoline, electricity, hydrogen) to end uses (e.g. personal vehicle use, space heating). See Figure 1.1.1 above. An energy balance is achieved by accounting for efficiencies, conversation rates, trade and losses at each stage in the journey from source to end use. Sankey diagrams provide an interesting visual representation or “picture” of energy flows, transformations and energy balance.
For any given year various factors shape this picture of energy flow, including: the population and the energy services it requires; economic activity; commercial floorspace; energy production and trade; the deployed technologies which deliver energy services (service technologies); and the deployed technologies which transform energy sources to currencies (harvesting technologies). The model makes an explicit mathematical relationship between these factors - some contextual and some part of the energy consuming or producing infrastructure - and the energy flow picture.
Some factors are modelled as stocks - counts of similar things, classified by various properties. For example, population is modelled as a stock of people classified by age and gender. Population change over time is projected by accounting for: the natural aging process, inflows (births, immigration) and outflows (deaths, emigration). The fleet of personal use vehicles, an example of a service technology, is modelled as a stock of vehicles classified by size, engine type and model year - with a similarly-classified fuel consumption intensity. As with population, projecting change in the vehicle stock involves aging vehicles and accounting for major inflows (new vehicle sales) and major outflows (vehicle discards). This stock-turnover approach is applied to other service technologies (e.g. furnaces, water heaters) and also harvesting technologies (e.g. electricity generating capacity).
This is the basis for projecting how the energy flow picture may change in the long term - by projecting potential change in the context (e.g. population, economy), projecting energy services demand intensities, and projecting the composition of energy system infrastructure, often with stocks. Stock-turnover models enable users to directly address questions about the penetration rates of new technologies over time constrained by assumptions such as new stock, market shares and stock retirements.
Throughout the CanESS accounting framework there are input variables - for user assumptions and projections - which collectively comprise an interface to controlling the physical trajectory of the energy system. Different settings of these inputs can be interpreted as alternative behaviours of various actors or institutions in the energy system (e.g. households, various levels of government, industry, etc). This interface can be directly set or controlled by the model user, to create "what if" type scenarios. The modelling platform upon which CanESS is built allows for a "higher layer" of logic to operate at this physical-behavioural interface, in effect enabling a flexible mix-and-match approach to behavioral models which connect to the same constraining physical model.
The CanESS energy systems modelling approach is distinct from other approaches such as: global optimization, which significantly limits the complexity and fidelity of any constraining physical model (constraint set); or those which "hardwire" a single economic/behavioural paradigm into a physical accounting framework.
2 CanESS Technical Description
2.1 Overview
The Canadian Energy Systems Simulator (CanESS), developed by whatIf? Technologies Inc., is an integrated, multi-fuel, multi-sector, provincially-disaggregated energy systems model for Canada. CanESS enables bottom-up accounting for energy supply and demand, including energy feedstocks (e.g. coal, oil, gas), energy consuming stocks (e.g. vehicles, appliances, dwellings) and all intermediate energy flows. It is calibrated with observed historical data from 1978 to the present, and it enables projection of scenarios forward to 2050 and beyond. The conceptual view of the energy system which underlies the development of CanESS is shown Figure 2.1.1.
Figure 2.1.1 - Conceptual view of an energy system underlying the design of CanESS
CanESS focuses on coherency – on creating scenarios assuring consistency among the population, level of economic activity, the services required by the population, the energy system, and the emissions of greenhouse gases and criteria air contaminants. It assures coherency both over time and within time periods through the use of stock-flow accounting rules, vintaged stocks and life tables, supply/disposition balances for fuels and feedstocks, and the explicit representation of energy transformations. The major sub-models and high level computational structure of CanESS are shown in Figure 2.1.2. A detailed description of the sub-models is presented in subsequent sections.
Figure 2.1.2 - High level computational structure of CanESS
CanESS is calibrated over historical time from 1978 to the present in one year steps. The result of the calibration is a complete historical database of all of the variables in CanESS adjusted to be coherent with the stock-flow and supply/disposition balance accounting identities of CanESS. This database is a synthesis of data from a wide variety of data sources including: Statistics Canada; the Office of Energy Efficiency, Natural Resources Canada; Transport Canada; Environment Canada; the National Energy Board; and technical data from various scientific and engineering studies.
2.2 Drivers
2.2.1 Demographics
CanESS contains a population cohort-survival model which stratifies the population by single year of age, gender and geographic region - and projects in 1-year time steps.The model accounts for births, deaths, international and interprovincial migration flows (immigration and emigration). Families by age class, size and structure are projected from the population via family formation rates; and in turn families form households via a families-per-household parameter.
This model structure makes CanESS suitable for a variety of analysis related to demographic trends, generational differences (Boomers, Gen X, Gen Y) and implications for shifting energy use patterns.
2.2.2 Macro Economy
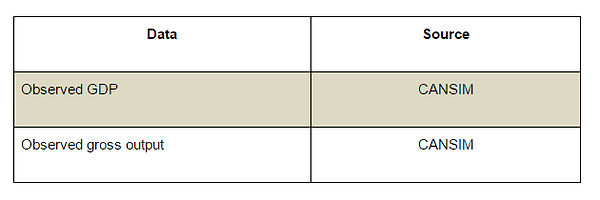
The table below shows the macroeconomic drivers that CanESS produces and the level of detail for those variables. CanESS derives each variable from population and a corresponding per capita parameter (e.g. GDP per capita).
CanESS includes the following non-fuel producing industrial sectors:
-
Construction
-
Pulp and paper
-
Smelting and refining
-
Cement
-
Chemicals
-
Iron and steel
-
Other manufacturing
-
Forestry
-
Mining
The major data sources for the macroeconomic model in CanESS are listed in the table below.
2.3 Final Demand Sectors
2.3.1 Residential End-use
The CanESS residential energy use model calculates energy use in detail by fuel type and end-use. Figure 2.3.1.1 below presents an overview of the energy end-uses captured in the CanESS residential model.
Figure 2.3.1.1 - Residential end-use model components


The dwelling stock is the primary driver of energy use. The number of dwellings is based on the number of households in a geographic region, which is ultimately driven by population. The dwelling stock is classified by geographic region, dwelling type, thermal archetype, and dwelling age.
The thermal archetype classification makes the CanESS residential model distinct from other energy models. Thermal archetype is an index from 0 to 100 representing the thermal conductivity of the dwelling. A thermal archetype index of 0 represents the highest potential to lose heat while an index of 100 represents no heat loss. CanESS can use this index to simulate scenarios in which the sealing and insulation of a dwelling changes over time, which can have a large impact on energy consumption in the space conditioning end-use.
Residential energy use is the summation of the energy use for each end-use shown in the overview diagram. The energy use within each end-use depends on the characteristics of the associated equipment stock and how that stock is used. Much of the equipment in the dwellings is vintaged such as heating systems, hot water heaters, air conditioners and major appliances, which allows CanESS to simulate stock turnover. Through stock turnover, older appliances are retired and replaced with newer appliances. In addition to stock turnover, CanESS supports stock conversions in which existing stock changes its characteristics. For example, CanESS can simulate a dwelling retrofit that increases the thermal archetype index.
The classifying indices that comprise the stock characteristics are shown for each stock type in the table below.
The major data sources for the residential model in CanESS are listed in the table below.
2.3.2 Commercial End-use
The CanESS commercial energy use model calculates energy use in detail by building type, fuel type and end-use. Figure 2.3.2.1 below presents an overview of the energy end-uses captured in the CanESS commercial model.
Figure 2.3.2.1 - Commercial end-use model components


The CanESS commercial model uses floor space and energy intensity parameters to derive energy use across commercial end-uses. The exception to this method is lighting, which uses a stock-based approach to calculate energy use.
CanESS represents the following set of commercial building types:
-
Wholesale
-
Retail
-
Warehouse - Transportation and Warehousing
-
Cultural - Information and Cultural Industries
-
Office - Finance, Retail, and Professional
-
Educational - Educational Services
-
Health - Health care and Social Assistance
-
Recreation - Arts, Entertainment and Recreation
-
Accommodation - Accommodation and Food Services
-
Other - Other Services (Except Public Admin)
The elements of this set may be mapped to match the desired commercial market segmentations.
Population drives both floor space that is related to overall population (i.e. retail, wholesale, cultural, recreation, accommodation, and other) and floor space depends on population within certain age ranges (i.e. health and education). GDP drives floor space for the warehouse building type while commercial office floor space depends on both population and GDP.
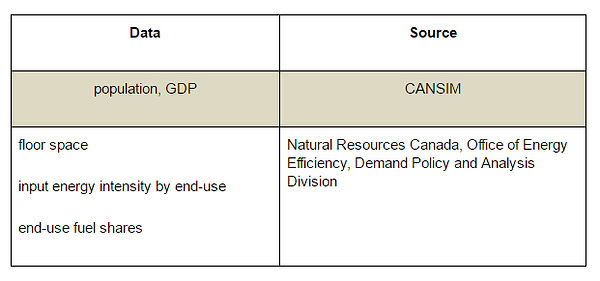
The major data sources for the commercial model in CanESS are listed in the table below.
2.3.3 Transportation
The CanESS transportation model calculates energy use by vehicle kind and fuel type based on service demand and road vehicle stock for both passenger and freight transportation. Figure 2.3.3.1 presents an overview of the sub-sectors within the transportation model.
Figure 2.3.3.1 - Transportation sector model components

CanESS first determines demand for passenger and freight transportation. CanESS calculates passenger transportation demand by generating trips using family data, which is derived from population and trips per family. Trips are classified by type (e.g. commuter, intercity) and transportation mode so that passenger transportation service demand is expressed as the required number of passenger kilometres for each passenger transportation mode for each province.
Freight transportation demand in CanESS is consistent with Gross Output by sector (agriculture, fishing, forestry, manufacturing and mining,oil and gas) and a tonne- kilometre intensity by sector. CanESS first splits the calculated tonne kilometres in domestic, imports and exports, and subsequently splits these by mode. Available modes for inter-city transport are commercial heavy duty trucks, rail, marine and air while intra-city freight is shipped only by commercial light and medium duty trucks. Transportation of crude oil by mode (pipeline, rail, marine, and truck) is modelled separately.
CanESS carries vintaged stocks of personal and commercial light duty, commercial medium duty, and commercial heavy duty road vehicles. Representing vehicle stock by age allows CanESS to simulate vehicle stock turnover and type conversions so that new fuel types or technologies may be introduced. For example, the addition of plug-in electric hybrid vehicles and electric vehicles to the personal vehicle stock can be simulated to understand its affect on electricity demand in the transportation sector.
CanESS allocates the required passenger kilometres and tonne kilometres to the light duty personal vehicle stock , and medium and heavy duty commercial vehicle stocks, to derive an annual distance travelled. For commercial light duty vehicles, CanESS applies a per vehicle per unit GDP intensity to derive annual distance travelled given the commercial light duty vehicle stock and GDP. CanESS carries annual distance travelled by province, vehicle type, vehicle power source, and vehicle age. Fuel consumption rate data are applied to the annual distance travelled data to calculate energy use.
Vehicle power source comprises engine type and fuel type. The light duty vehicle power sources contained in CanESS are shown in the table below.
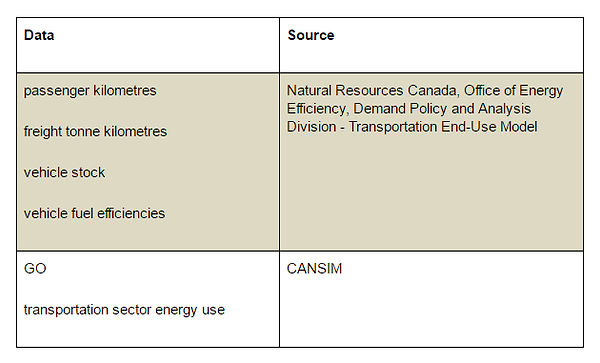
The major data sources for the transportation model in CanESS are listed in the table below.
2.3.4 Industrial
The CanESS industrial end use model calculates energy use by industry sub‑sector, industrial end use, and fuel type. Figure 2.3.4.1 presents an overview of the structure within the industrial model.
Figure 2.3.4.1 - Industrial model components


CanESS derives industrial GDP as a fraction of Canadian GDP for each industry sub‑sector. An exogenously driven intensity determines the amount of energy each sub‑sector consumes for a particular end use given the industrial GDP level. Energy use is shared over industrial sector fuel types.
For the fertilizer production sub-sector, CanESS maintains production levels that are consistent with the amount of seeded crop land, the fraction of crop residue present after harvest, and the amount of available animal fertilizer. Fuel use and natural gas feedstock use are then calculated based on fertilizer production.
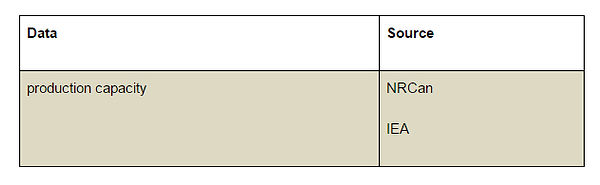
The major data sources for the industrial model in CanESS are listed in the table below.
2.4 Energy Production
2.4.1 Electricity Generation
CanESS includes 33 different generation technology archetype plants. Of these types, nuclear, coal, combustion natural gas, combined cycle natural gas, solar photovoltaic, on-shore wind turbines, bioenergy, hydro, tidal, wave and river current comprise the bulk of electricity generation between 2010 and 2050. CanESS simulates power plant retirement, new generation capacity, infrastructure additions and demand changes in one-year time steps.
The type and amount of generation available is based on currently installed capacity in each province and is modified annually to meet an annual electricity demand projection.
In addition to projecting annual electricity generation capacity and generation, CanESS simulates an hourly dispatch algorithm by dispatching available technologies to match an 8,760-hour load shape that reflects electricity demand from electricity-consuming devices each year. The sector models in CanESS provide a detailed representation of electricity use by end use, which serves as the level data to which sector-specific hourly load shapes are applied. The resulting demand patterns are associated with individual residential end-uses, commercial building types, industrial sector end‑uses, and transportation mode types.
“Must run” generation types – wind, solar, and all marine energy types – are assumed to be dispatched when available. Average hourly “must run” resources and output patterns are calibrated based on historical power output for wind and solar, but synthesized for marine energy based on resource data and generalized device characteristics. Base load generation technologies are then dispatched, followed by load following technologies. In each case, generation is dispatched to the available technologies according to a parameterized, distributed merit order method.
This method takes a realistic rather than an optimized approach to dispatch, recognizing that non-price factors, such as voltage support, are also considered in the dispatch process. The parameters of the distributed merit order method can be set to reflect the economics of dispatch as well as other factors.
In this dispatch method, base load generation in excess of demand in any hour is assumed to be exported. Load following capacity is only run up to the level required to meet demand. Electricity demand that is not dispatched requires imports. Dispatch parameters are calibrated to ensure tracking on observed electricity generation and electricity trade over time.
2.4.2 Refined Petroleum Products
CanESS includes ten energy-related refined petroleum product (RPP) types. RPP products may be produced from conventional crude oil (light, medium, or heavy), synthetic crude oil, bitumen, or liquefied coal. CanESS represents bitumen extraction through oil sands mining and in situ recovery. The extracted bitumen can either be diluted with natural gas liquids or synthetic crude oil to produce diluted bitumen or upgraded to produce synthetic crude oil. The synthetic crude oil production simulation also includes the production of by‑product fuels.
2.4.3 Biofuels
The biofuel production component in CanESS models the production of ethanol and biodiesel through variety of processes. Given a biofuel production capacity stock and a load factor to indicate how much the available capacity is being deployed, the model calculates the biofuel produced, the required feedstock, and the produced by-products for each of the processes. Then it calculates the energy used in the biofuel production.
2.4.4 Other Transportation Fuels
The other transportation fuels production component models the production of ester reformed gasoline, ester reformed diesel, dimethyl ether, and methanol. The demand for these fuels mostly originates in the transportation sector where a limited number of vehicle power sources depend on these fuels. The model calculates feedstock and external energy requirements in order to meet the demand for these rather exotic fuels.
2.4.5 Hydrogen
The production of compressed, liquefied or metal hydride hydrogen is modelled through a variety of processes (steam reforming, partial oxidation, gasification, high temperature splitting, and electrolysis). Given a demand for hydrogen the hydrogen production component of the model calculates the feedstock and energy requirements for producing and storing hydrogen, and evolves the infrastructure required.
2.4.5 Liquid Natural Gas
The liquid natural gas component calculates the natural gas as well as the electricity required to liquefy natural gas.
2.4.6 Steam
The external steam production component calculates the net demand of steam, that is, the demand for steam that is not met by cogenerated steam from the utility sector. Then it calculates the fuels required to generate this steam, either through conventional and unconventional methods.
2.4.7 Decentralized Energy
The model distinguishes between decentralized electricity and heat production that is biomass sourced, and decentralized energy fueled by other feedstocks. Some capacity in these classes can produce only heat, some only electricity, and some produce both heat and power. The model covers small and large scale biomass conversion to heat and power, and these technologies can run on a number of biomass types.
The multitude of non-biomass sourced technologies and their energy inputs are listed in the table below.
The decentralized heat produced is translated into the displacement of fuels that would be required to generated the decentralized heat and this displacement offsets fuel demand in certain sectors. The model user controls which sectors obtain the produced heat (i.e. the fuel offsets). The decentralized electricity produced is subtracted from total grid demand for electricity at point of use to determine the net demand for electricity at point of use.
2.5 Primary Resources
2.5.1 Crude Oil
Crude oil production in CanESS comprises so-called conventional production (i.e. not from the oil sands) and production from the oil sands. Target conventional crude oil production levels are specified as exogenous inputs by province and crude oil type for each year of simulation time.
CanESS represents the following set of conventional crude oil types:
-
light and medium crude oil
-
light and medium crude oil from tight recovery
-
heavy crude oil
-
heavy crude oil from tight recovery
The energy used to produce conventional crude oil is calculated as an intensity multiplied by the production level. The energy intensity, expressed as energy per unit of crude oil produced, is specified exogenously by province, crude oil type, and fuel type used for each year in simulation time.
The fuels that are available in CanESS for conventional crude oil production are:
-
liquefied petroleum gas (LPG)
-
still gas
-
motor gasoline
-
kerosene and stove oil
-
diesel fuel oil
-
light fuel oil
-
heavy fuel oil
-
petroleum coke
-
aviation gasoline
-
aviation turbo fuel
-
compressed hydrogen (CH2)
-
liquid hydrogen (LH2)
-
compressed natural gas (CNG)
-
liquid natural gas (LNG)
-
dimethyl ether (DME)
-
biodiesel
-
ethanol
-
methanol
-
electricity
-
natural gas
-
natural gas liquids (NGL)
-
coal
-
coke and coke gas
-
steam
-
wood
CanESS represents the following set of oil sands crude oil types:
-
synthetic crude oil (SCO)
-
diluted bitumen
CanESS models two oil sands recovery methods: mined and insitu. Mined recovery consists of four steps:
-
extraction
-
consolidation and transport
-
crushing
-
separation
Both recovery methods output crude bitumen, which is either upgraded to produce synthetic crude oil (SCO) or diluted with SCO or natural gas liquids to make diluted bitumen. Crude bitumen production levels are specified exogenously for each recovery type. The material and energy flows through each of step of mined recovery and the insitu recovery process depend on the target level of crude bitumen production and various intensity parameters within the oil sands sub model.
The fuels that are available in CanESS for oil sands production are:
-
natural gas / synthetic gas
-
electricity
-
diesel
-
bottom of the barrel
-
coke
-
synthetic crude oil
-
hot water
-
steam
The final outputs of oil sands production are SCO and diluted bitumen. Co-products of upgrading included in CanESS are synthetic gas, residual fuels, process gases, and diesel fuel oil.
CanESS uses the derived energy use to calculate emissions from combustion and the crude oil production levels to calculate fugitive emissions. The model structure also allows for the simulation of carbon sequestration in the future.
While the exogenously specified production levels determine the crude oil domestic supply, domestic crude oil demand comes from the feedstock demands of the refineries. CanESS determines interprovincial and international trade so that the following identity is preserved for each province and crude oil type:
production + imports = consumption + exports
2.5.2 Natural Gas
CanESS models three types of natural gas production: conventional, unconventional, and associated. Conventional natural gas production is specified exogenously.
CanESS simulates unconventional gas production as well-based and non well-based. Well-based unconventional gas comes from a collection of wells whose total production is determined by the following exogenous inputs, which are specified by natural gas basin:
-
initial production level - the starting production rate in Bcf / well of a well that is completed in a given year
-
decline curve - the fraction of the initial production level that is produced after the well is completed. It is specified by simulation year and by time after completion (0-50 years)
-
well rate - the rate at which new wells are completed
These inputs combine to create a detailed well model in which for a given year in simulation time, total unconventional gas production is the sum of initial production from newly completed wells and declined production of wells completed in previous years.
Non-well based unconventional gas production is specified exogenously like conventional gas production.
CanESS includes the following unconventional gas resources types:
-
offshore
-
coalbed methane
-
shale
-
tight
-
hydrates
Associated natural gas production relates to conventional oil production through a ratio which is calibrated to observed production of both oil and associated natural gas. The observed associated or solution gas is published in the NEB outlook reports and the crude oil production is detailed in the above section.
There is a parameter that determines what fraction of associated gas is re-injected to increase oil production. This practice is being used in Newfoundland where there is no infrastructure for domestic natural gas use in the traditional end use sectors.
Other sources of natural gas production supported by CanESS include synthetic gas from oil sands production, biomass to natural gas conversion, and coal gasification. Natural gas production from from the oil sands and biomass are calculated upstream in other sub-models in CanESS. Natural gas production from coal gasification is specified exogenously.
CanESS calculates energy use for natural gas production by multiplying an intensity by the total production level. The derived energy use is separated into own use and external use. Own use natural gas is assumed to be raw natural gas when emissions are calculated while external natural gas is assumed to be marketable natural gas.
2.5.3 Natural Gas Liquids
CanESS simulates natural gas liquids (NGLs) production in the refined petroleum production and the natural gas extraction sectors. Refinery-based production generates NGLs as liquefied petroleum gases (LPGs) while natural gas extraction produces NGLs as a component of the extracted natural gas.
The rate of LPG production in CanESS is the production level required to meet domestic demand for LPGs, net exports of LPG, and own use of LPGs within petroleum product production sector. Total domestic demand for LPGs is calculated upstream in CanESS. Disposition parameters that control the amount of LPG imported, exported, and traded among provinces are specified exogenously as are LPG own use parameters. The trade disposition parameters are calibrated in historic time to be consistent with the LPG imports and exports reported in RESD. The LPG own use parameters are calibrated in historic time so that total own use consumption of LPG tracks on the producer consumption of LPG reported in RESD.
NGL production from natural gas extraction depends on the amount of natural gas produced. While natural gas production is calculated upstream in CanESS (see Natural Gas section), the ratio of NGL to natural gas produced is an exogenous input. This NGL ratio is calibrated in historic time so that NGL production tracks on the production reported in RESD.
2.5.4 Coal
Coal production by province is an exogenous parameter in CanESS. The production level is multiplied by an energy intensity, which is also exogenous, to derive energy used in coal production by fuel type. Energy use is further divided between own use coal and external fuels. The level of coal production in historic time is calibrated to match production levels published in the Canada Mineral Yearbook. The coal production energy intensity is calibrated to be consistent with imputed energy use coal mining from RESD.
Coal consumption is calculated upstream in the model for both the final demand and energy production sectors. CanESS reconciles coal production and consumption at the provincial levels with interprovincial and international trade. An exogenously specified disposition plan influences the derived imports and exports among the provinces and internationally.
2.5.5 Uranium
Uranium production by province is an exogenous parameter in CanESS. The production level is multiplied by an energy intensity, which is also exogenous, to derive energy used in uranium production by fuel type. CanESS also tracks known uranium reserves to calculate remaining reserves after the specified annual production. The uranium stock is an exogenous variable so that reserves may be increased in the projection period in order to simulate new resource discoveries.
In CanESS uranium may be used for grid electricity production as well as electricity production in the industrial, commercial, and oil sands sectors. Uranium may also be consumed as a fuel for the production of hydrogen from nuclear energy. CanESS reconciles uranium production and the derived consumption at the provincial levels with interprovincial and international trade. An exogenously specified disposition plan influences the derived imports and exports among the provinces and internationally.
2.5.6 Biomass
Sources of biomass in CanESS include forests, agriculture, and municipal solid waste. Biomass from the forestry sector is divided further between mill residue and non-merchantable wood, which includes:
-
roadside harvesting residue
-
harvestable non-merchantable wood
-
immature biomass as coproduct of development
-
biomass potentially available from FireSmart treatments
-
bug wood and other infested merchantable wood
2.6 Energy Trade
CanESS uses trade of energy resources (e.g. crude oil and natural gas) and energy currencies (e.g. electricity and refined petroleum products) to reconcile differences between energy supply and demand at the provincial level. The total demand for a given energy product is consolidated from all sectors in the model. CanESS adds domestic production and imports to derive a “make” total. Likewise, CanESS adds domestic demand and exports derive a “use” total. CanESS uses these two control totals to calculate a trade disposition matrix using mathematical rake technique with a disposition plan as a starting seed. The calculated trade disposition matrix explicitly specifies how an energy product is routed from the province in which it is produced to the provinces in which it is used as well provincial imports and exports.
2.7 Data Sources and Calibration
CanESS is calibrated over historical time from 1978 to 2010 in one year steps. The calibration process combines observed data from many different sources to derive historical values for the stock, flow, and parameter variables in CanESS. Calibration is an indispensable step in the creation of a simulation model because it validates the structure of the model, provides a historical trend for the model variables from which simulation inputs may be derived and ensures coherency among model variables.
This section first gives a general description of the calibration process in CanESS then discusses this process in detail for conventional crude oil production as a specific example.
The primary data sources used for CanESS calibration are:
-
Report on Energy Supply and Demand (RESD) from CANSIM
-
other CANSIM tables
-
Energy Efficiency Trends Analysis Table from the Office of Energy Efficiency of Natural Resources Canada
-
Energy Futures Reports from the National Energy Board
-
National Inventory Report from Environment Canada
-
Expert estimates (when observed data is not available)
These sources provide observed data for stock and flow model variables such as:
-
stocks
-
population
-
resource reserve levels (natural gas, bitumen, conventional crude oil)
-
dwellings
-
vehicles
-
appliances
-
electricity generation capacity
-
agricultural land
-
-
flows
-
gross domestic product (GDP)
-
gross output
-
production (resource and energy)
-
passenger kilometres
-
tonne kilometres
-
trade (interprovincial and international)
-
energy use
-
emissions
-
Generally, calibration adjusts input parameters that control the stock and flow variables so that the calculated stocks and flows track on the observed data. For stocks, adjusted parameters include life table parameters and shares over type for new stock. In some cases, parameters that control the demand for stock may be adjusted as well. For flows, adjusted parameters are typically intensity variables that are multiplied by an input flow to calculate an output flow or planned trade disposition between provinces and internationally..
Because of the compositional richness of CanESS, its variables include a high level of detail. For example, residential dwellings are organized by province, type, thermal archetype, and age. Observed data usually does not contain the same level of detail as the CanESS variables, which complicates the calibration process. Another complicating factor is the dynamic interactions among the model variables. Adjusting a parameter to track on an observed stock may affect a calculated flow in another area of the model. Each final demand sector, energy production sector, and resource supply therefore has its own custom calibration process.
The calibration of the conventional crude oil sector provides a specific example. The starting point for crude oil calibration is total crude oil production and imports. Total domestically produced and imported conventional crude oil come from CANSIM Table 126-0001. Domestic use and exports of crude oil also come from CANSIM Table 126-0001. The production and use data are combined to create a total crude oil disposition matrix that specifies for each province how much crude oil is produced or imported, which provinces consume that crude oil, and how much crude oil is exported.
Another important piece of information in 126-0001 is the classification by crude oil type. CanESS uses this information to split total crude oil production from RESD by crude oil type (light/medium, heavy, synthetic, diluted bitumen). CanESS uses CANSIM Table 134-0001 to split domestic crude oil consumption by crude oil type. The total crude oil disposition matrix, production by crude oil type, and use by crude oil type are combined through a mathematical rake to derive a detailed disposition matrix for crude oil. This derived disposition matrix is now a calibrated flow parameter that helps to determine crude oil trade and ensures that crude oil production and imports equals crude oil consumption and exports for each province and crude oil type.
At the end of the crude oil production calibration, crude oil production, imports, and exports from CanESS track on RESD values while consumption by crude oil type tracks on 134-0001.
For energy use in the conventional crude oil sector, an energy intensity parameter is derived by dividing a fraction of the line “Total mining and oil and gas extraction” in RESD by crude oil production from 126-0001.
Conventional crude oil production emission intensity is reported in the Environment Canada’s National Inventory Report - NIR 2010-Part1 Final - Figure 2-12 "Emissions intensity by source type for fossil fuel production".
2.8 Reference Scenario
The CanESS reference scenario is neither a forecast nor a prediction. Rather, this scenario is meant to be a reasonable starting point from which to build simulation scenarios and to provide results for comparisons.
While the reference scenario may be customized to suit the requirements of a particular project especially with respect to the area of study, the CanESS reference provides a reasonable simulation for the areas not in scope for that study but which will have an impact due to the system wide integrated approach to CanESS.
The CanESS reference scenario is intended to represent:
-
continuing historical trends from 30 years of historical data (with saturation limits)
-
known developments in the future such as:
-
committed production capacity to be built
-
regulations or standards
-
communicated policies
-
The reference scenario is built in two steps:
-
create a "flywheel" scenario for most input variables which continues the historic trend from history up or down to an asymptote which is a certain percentage of the last historical year
-
enhance the “flywheel” scenario by:
-
overriding certain key variables to track on projections from other organizations that are recognized subject area experts
-
setting input variables to represent known committed regulations & policies
-
incorporating expert opinions where appropriate
Figure 2.8.1 below illustrates the approach to developing the reference scenario construction. The black line represents calibrated historical data. The bright green line through history is the historical trend while the blue line is that same trend shifted upwards so that it joins the last year of history. The flywheel projection, shown in the red line, is a projection of the blue line at a 50% saturation (i.e. the final level of the red line is 50% higher than the last year of history). The green line represents adjustments made to the flywheel projection that align the projected variable with third party projection.
Figure 2.8.1 - Projecting approach showing fixed, flywheel and reference scenarios


Need more details? Contact us

A product of whatIf? Technologies Inc.
CanESS is developed and maintained by whatIf? Technologies Inc., an Ottawa-based firm specializing in modelling, simulation and quantitative scenario analysis. For more information visit whatiftechnologies.com.
whatIf? Technologies © 2016 All Rights Reserved